
To understand how to analyze class attendance data, start with consistent records and calculate the daily attendance rate as the number of attendees divided by the number of people expected, multiplied by 100. Review exceptions such as cancellations and no-shows separately so they don’t distort the...

To understand how to analyze class attendance data, start with consistent records and calculate the daily attendance rate as the number of attendees divided by the number of people expected, multiplied by 100. Review exceptions such as cancellations and no-shows separately so they don’t distort the result.
Reliable analysis starts with clean records, not a polished dashboard. A daily percentage can look useful, but inconsistent status codes, duplicate entries, or missing information can make it misleading. First establish what happened in each class, then look for patterns.
This guide explains how to check attendance data quality, calculate daily rates, account for exceptions, and interpret trends across your organization. You’ll learn how to compare classes and time periods, identify changes worth investigating, and use attendance patterns to make better-informed scheduling and operational decisions.
• Consistent attendance codes and complete records make class comparisons more meaningful.
• Separate late arrivals, early departures, and other exceptions so daily rates reflect what happened in each class.
• Compare attendance across classes and time periods to spot patterns that a single daily rate can hide.
• Track attendance alongside cancellations and participation patterns to make the numbers more useful for planning.
• Studio management software can bring class scheduling and attendance information together for a clearer organization-wide view.
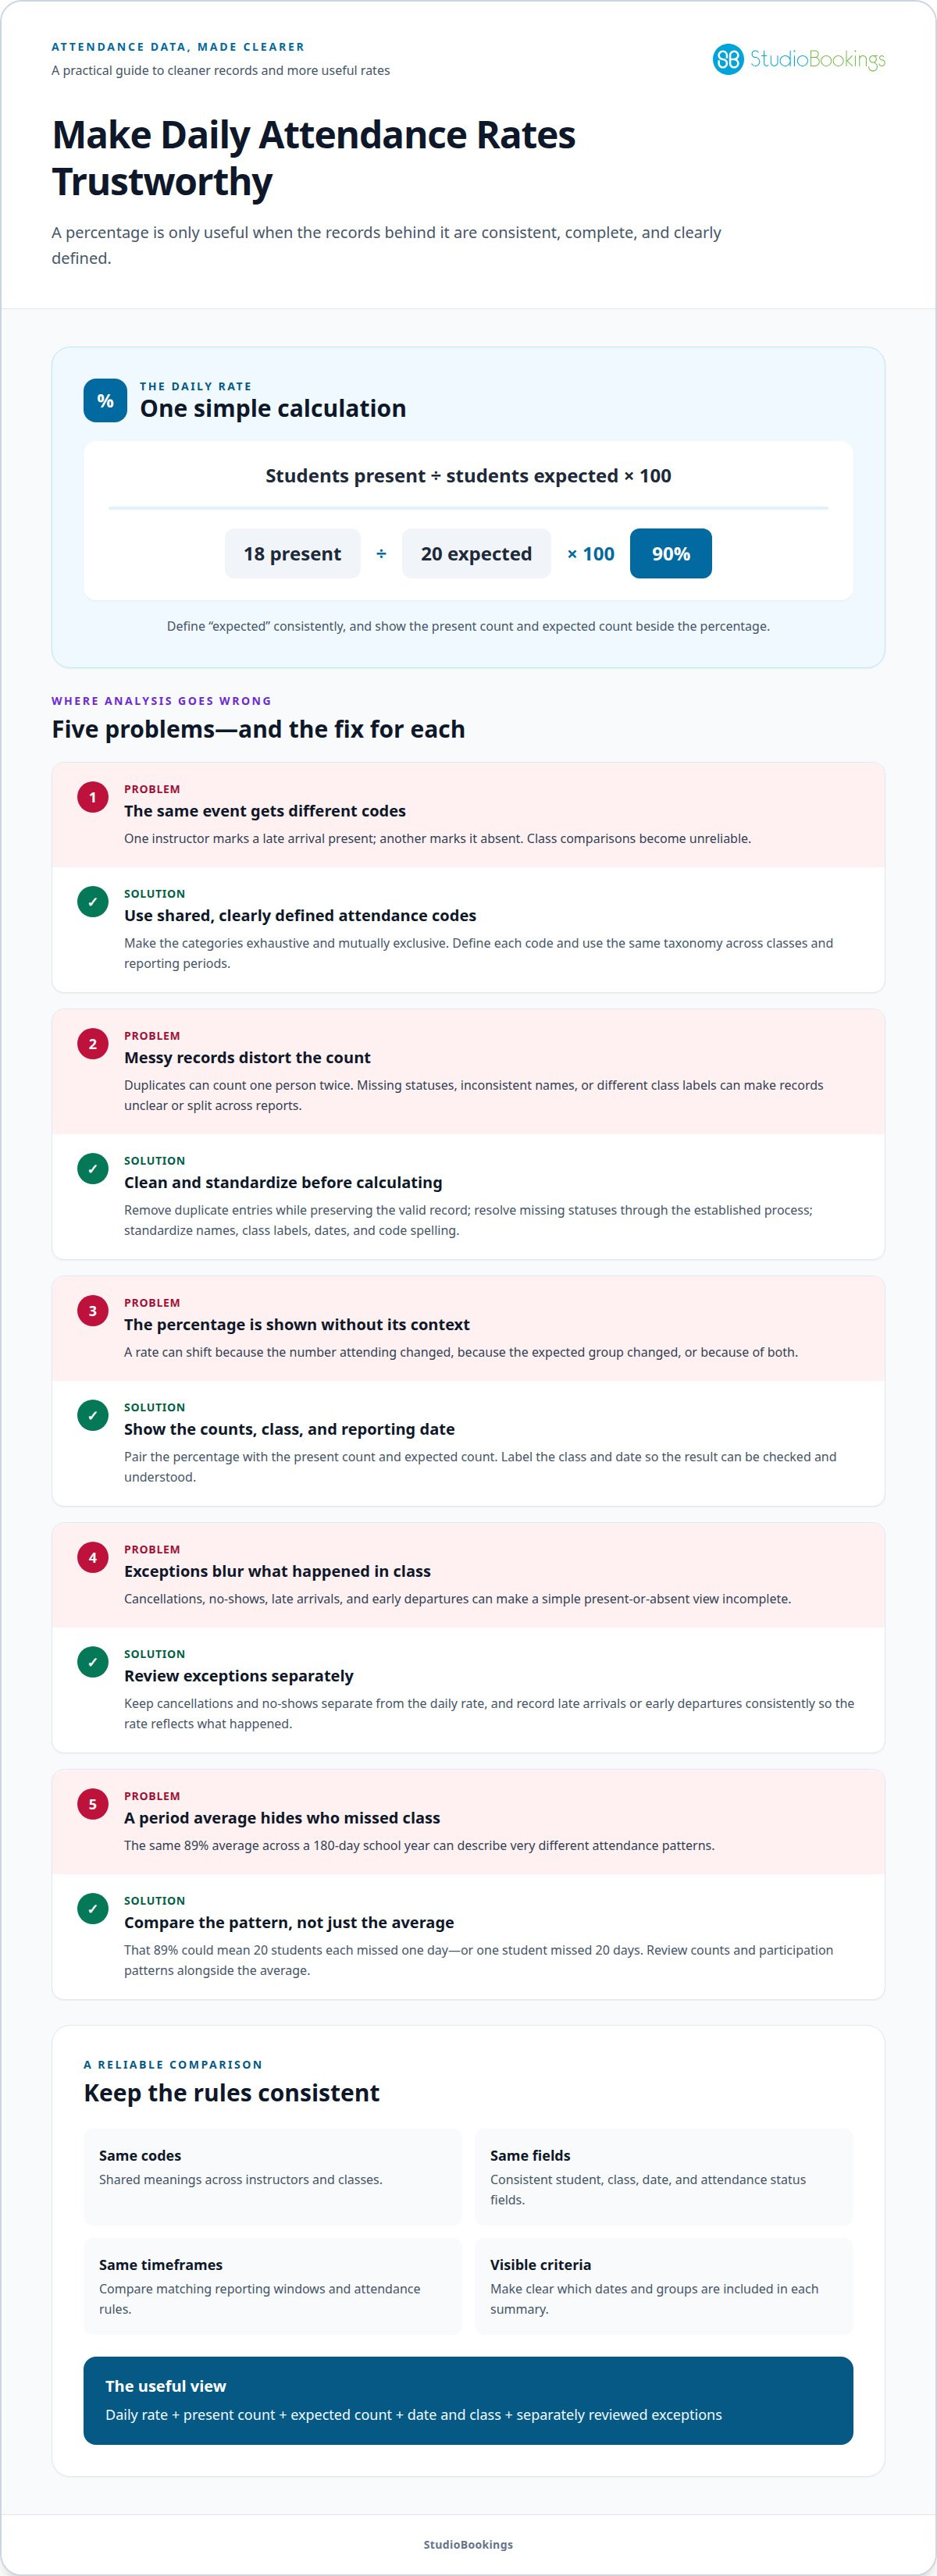
A daily rate is useful only when every attendance record means the same thing. If one instructor marks a late arrival as present and another marks it absent, class comparisons are unreliable. Define a shared set of attendance codes and use it across every class and reporting period.
A strong attendance taxonomy is exhaustive and mutually exclusive: each student’s status at a given time fits one code, without overlap or common situations left unclassified. For example, codes might distinguish present, absent, and late. Define each code clearly so instructors record the same event consistently.
Shared definitions also help organizations compare records created under different local attendance policies. A common taxonomy can map different definitions to consistent categories, making comparisons more useful while preserving the original meaning. Document how local codes map to shared categories rather than silently changing old entries.
Before calculating a rate, clean the underlying student data. Duplicate records can count one person twice, while missing values can make a class appear smaller or leave attendance status unclear. Inconsistent names, class labels, or date formats can also split one group across multiple report lines.
• Remove duplicate attendance entries while preserving the valid record.
• Identify missing statuses and resolve them using the attendance record’s established process.
• Standardize student names, class labels, dates, and code spelling.
• Keep a consistent header for each field, such as student, class, date, and attendance status.
For example, “Present,” “present,” and “P” may mean the same thing, but a spreadsheet can treat them as separate values. Standardize entries before grouping or summarizing them. In Excel, use clear columns for student names, grades, and attendance to sort records and spot inconsistent values.
Use a review process that preserves context. A blank status should not automatically become absent: the record may be incomplete rather than confirmed. Don’t erase a correction without retaining a trace of the change. A useful data set distinguishes recorded information from unresolved entries.
In the United States, the Family Education Rights and Privacy Act (FERPA) protects student attendance records. Limit access to identifiable student data to people who need it for their work, and use aggregated results when individual identities aren’t needed to review trends.
Finally, check that every class uses the same reporting window and attendance rules. Consistent codes cannot fix records collected across different periods or definitions. Align codes, fields, and timeframes before relying on daily rates or organization-wide comparisons.
A daily attendance rate shows the share of expected students who attended on a particular day. Define “expected” consistently when comparing classes, dates, or groups. The percentage is a useful headline, but the counts behind it show what changed.
Divide the number of students present by the number expected that day, then multiply by 100. This gives the daily attendance rate and allows comparisons across classes of different sizes. For example, if 18 of 20 expected students attend, the rate is 90%.
Show the present count and expected count alongside the percentage. If the expected group changes, the rate can shift even when the number attending stays the same. Label the reporting date and class so readers know which session the result describes.
A period average gives a broader view, but it can conceal individual patterns. In a 180-day school year, a school can have an average daily attendance rate of 89% when 20 students each miss one day. The same 89% rate can occur when one student misses 20 days. The total alone doesn’t show how absences are distributed.
Attendance metrics describe participation from different angles. Tracking them together helps distinguish a daily dip from a sustained pattern and gives the rate useful context.
Pair daily rates with attendance counts and period averages. A daily rate describes one date; an average summarizes the dates included. In Excel, AVERAGE and COUNTIF can summarize percentages or count records that meet a defined condition.
Use matching reporting windows in every comparison. A short period and a longer one don’t describe the same pattern, even if their averages look alike. Label the dates clearly, then compare equivalent classes or groups. Knowing how to analyze class attendance data starts with understanding what each figure includes.
In Excel, sort or filter records by date or group before summarizing them. Keep one row per student and date, with an attendance status that supports the selected metric. Count present records, divide by the expected count, and multiply by 100. This makes the calculation easier to trace back to its source.
When learning how to analyze class attendance data, read the percentage alongside its counts and timeframe. A shift may reflect attendance, a change in the expected group, or both. Show the date, present count, expected count, and rate together so a school team can decide which pattern deserves closer attention.
Excel sorting, filters, and formulas such as AVERAGE and COUNTIF can help calculate key school-data metrics. Use sorting or filters to isolate the dates or groups represented by the expected count, then apply formulas only to records within that scope. Keep the criteria visible so readers know what was included. Compare summaries using the same selection rules, and review each calculated figure alongside the present and expected counts. This makes the metric easier to interpret and verify.
A present-or-absent label can hide important differences. Someone who arrives late attended part of the class; someone who leaves early did not stay until the end. Record these events distinctly so an absence, partial attendance, and class cancellation remain distinguishable in reports.
Set a consistent rule for what counts as attendance in each metric. A headcount measure might count everyone who entered the class, while a participation measure might separately record late arrivals and early departures. These measures answer different questions, so label them clearly instead of combining them into one unexplained rate.
For example, a student arrives after instruction begins and leaves before class ends. Record both timestamps or their corresponding status codes. A single “present” entry misses the shortened attendance; an “absent” entry erases the part attended. Preserve the detailed record, then apply the same reporting rule across classes.
Handle exclusions separately. A class canceled by the organization is not the same as a scheduled class with an absence. If canceled sessions remain in the attendance denominator, the rate may suggest lower participation even though no class took place. Mark cancellations separately and define whether the metric includes only sessions that ran.
Other cases also need clear categories. Someone may reserve a place but not attend, join from a waitlist, or have a booking removed before class. These events affect booking and attendance measures differently. Keep the underlying statuses separate, then select only relevant records for each calculation.
Record attendance and the arrival time or late status.
Record attendance and the departure time or early-exit status.
Mark whether the class was canceled by the organization or another recorded cause.
Distinguish a missed reservation from a class that did not run.
Document the reason a record is excluded from a specific metric.
In a comprehensive report, retain detailed statuses even if the summary uses broader categories. A manager might need total attendance for a daily overview, then late arrivals by class to understand start-time patterns. Make the summary’s inclusion rule visible so the same record isn’t counted differently across reports without explanation.
Review exceptions as patterns, not automatic judgments about individuals. Repeated late arrivals in one class may prompt a closer look at scheduling or arrival procedures. Compare similar sessions and reporting periods before interpreting the change. Clear exception handling keeps the attendance rate useful and preserves the context behind each absence or partial visit.
An exhaustive, mutually exclusive attendance-code set records a student’s status at a given time. Chronic early absence may leave students unable to read proficiently by third grade.
Organization-wide trends show how student attendance changes across classes, grades, groups, and time. Compare equivalent periods and categories to find patterns a single class report may miss.
Group comparisons place attendance rates side by side for classes, grades, or student groups. They can reveal where attendance differs, helping teams investigate patterns and direct support thoughtfully.
Use the same attendance definition and reporting period for every group. Compare both rates and underlying counts, since a percentage alone can obscure how many students it represents. Excel PivotTables can summarize school data by class, subject, or time period. Disaggregating student data can also help identify groups with unmet needs and guide more equitable support.
Interpret each comparison in context. A class with lower attendance may have a different schedule or enrollment pattern than another class. Start with consistent categories, then investigate the conditions behind the difference instead of treating a ranking as an explanation.
Chronic absenteeism means missing 10% or more of school days. Reviewing individual attendance over time helps identify students approaching or meeting that threshold, so teams can respond before a pattern deepens.
Look beyond the organization-wide average. The 2023-2024 school year saw nearly 15 million students chronically absent, while 32% of high schoolers missed more than 10% of school days. These figures show why individual and group patterns matter alongside overall rates. A student-level view can reveal repeated absences that a strong class average might conceal.
Attendance visualizations turn summarized records into charts that make changes easier to see. They help teams spot differences across classes and track whether attendance rises or falls over time.
Use a line chart to show attendance across reporting periods and a bar chart to compare classes or grades. Excel PivotCharts can visualize summarized school data, while an Excel dashboard can bring key metrics and charts together. Keep labels, timeframes, and group definitions clear; otherwise, a visual comparison may suggest differences caused by inconsistent reporting.
Descriptive methods, including counts, percentages, averages, and comparisons over time, summarize attendance records. They help distinguish a broad shift from an isolated change and make findings easier to communicate.
Calculate rates for consistent periods, then compare averages across classes or dates. Use counts to show how many students contribute to each rate, and filters or PivotTables to examine a specific group. An attendance dashboard may default to the past 30 days and allow another period. Pair the numbers with relevant context before choosing a response.
Track a focused set of measures showing who attends, how participation changes, and where follow-up may help. Pair each metric with a clear definition and reporting period so comparisons remain useful across classes.
Attendance rate: Compare attendees with the people expected in each class. Keep the count and rate together. A rate of 80% means something different for a small class than a larger one, so the attendee count adds essential context.
Attendance count: Record how many people attended each session. This gives a direct view of participation and helps distinguish a percentage shift caused by attendance from one caused by a changing expected group.
Class-level and time-based patterns: Summarize attendance by class, instructor, day, or reporting period. Excel PivotTables can group records by class or time, making repeated differences easier to spot. Compare equivalent periods rather than treating one busy or quiet day as a lasting trend.
Absence and attendance exceptions: Track absences and relevant status categories separately. This helps explain rate changes and keeps summaries connected to the underlying records. Use consistent definitions so the same event isn’t counted differently across reports.
Attendance-sheet completion: Monitor whether records are complete, not just what the attendance totals show. An attendance-sheet distribution can distinguish sheets with no attendance recorded, partial completion, and full completion. This makes missing data visible before it weakens comparisons.
Individual patterns: Review attendance over time alongside organization-wide averages. In school reporting, chronic absenteeism is defined as missing 10% or more of school days. That threshold is a school measure, not a universal class-attendance target; use measures that fit the setting and the decision being made.
Context behind attendance: A count shows what happened, but not why. Combine quantitative attendance records with relevant qualitative information, such as student or family feedback in school settings. This can help identify barriers and shape targeted support instead of relying on a percentage alone.
Choose metrics based on the decisions they support. A class manager might use attendance counts to plan session capacity, while an organization-wide review might compare rates across classes and time periods. Keep definitions, date ranges, and categories visible in every report. A dashboard can bring measures together, while Excel charts make changes easier to interpret.
As a practical starting point, report attendance rate, attendee count, absences, record completion, and trends by class and period. Review the measures together before changing schedules or class plans. This gives you a clearer view than any single figure and helps turn attendance records into decisions grounded in patterns.
StudioBookings offers Pole and Dance Studio Software for studios managing classes, memberships, payments, and staff. Its cloud-based platform brings these tasks into one dashboard, giving you a central place to manage day-to-day studio activity.
Attendance analysis can highlight where class participation changes. If the review also reveals a need to organize schedules or membership administration, studio management software can support those tasks. StudioBookings helps pole and dance studios manage these activities together, while attendance decisions stay grounded in the records and metrics you’ve reviewed.
Contact StudioBookings to discuss how its software can support your pole or dance studio.
Attendance records become more useful when they inform a practical choice: adjust a schedule, review a class format, or focus on a pattern that needs attention. Connect the analysis to decisions your studio can make, then revisit the results as classes and attendance change. That’s how learning to analyze class attendance data can support informed growth instead of producing a report that gets filed away.
If managing classes and studio operations is part of your next step, StudioBookings offers Yoga Studio Software, Pilates and Barre Studio Software, and Fitness and HIIT Studio Software. Choose the setup that fits the work you need to manage, from scheduling to memberships and payments.
Contact StudioBookings to discuss your studio’s needs. Use your attendance insights as a starting point, then keep building a clearer picture of what helps your studio thrive.
Conflicting recording habits, unclear exceptions, and incomplete class records make attendance figures hard to interpret. Assign responsibility for recording attendance and documenting corrections, then keep a short reference explaining each status code. For example, distinguish a canceled session from one with no attendees. Review a sample of completed records against the original check-in information to catch recurring process issues early.
Calculate the class attendance rate as attendees divided by people expected, multiplied by 100. Calculate the absenteeism rate as absentees divided by people expected, multiplied by 100. For example, if 18 of 20 expected people attend and the remaining two are absent, attendance is 90% and absenteeism is 10%. These rates complement each other when every expected person has one attendance status.
Clean records by checking that each student, class, and date combination appears only once and that dates match scheduled sessions. Validate totals against the original check-in records. If a class summary shows more attendees than the source record, investigate before using its rate. Keep corrections traceable, and flag unresolved records instead of silently assigning them an attendance status.
Compare equivalent periods and class types, then look for sustained changes rather than reacting to one unusual session. For example, compare the same weekday and class format across reporting periods, noting schedule or format changes that could affect participation. A line chart can make direction and timing easier to see. Pair the rate with attendance counts so changes in expected class size remain visible.